Statistics becomes easier when the foundation is strong. Discrete vs continuous is one of the most significant concepts that students, amateurs and even professionals are to realize well. These two are mistaken by many learners as they both are about numbers, but their conduct is quite different. This misunderstanding causes errors in exams, graphs, probability, and analysis of data. To effectively comprehend this subject, one should not be confined in definitions but rather see how values act in practice.
What Is a Variable?
In mathematics and statistics, a variable is a value that may vary according to conditions or observations. These values are not rigid and can vary in various situations. Variables are ubiquitous in real life. The attendance of people on a particular class is not the same every day, and the temperature is not the same during the day.
The nature of the two is not similar, even though they both deal with numbers. The distinction between variables into different types, such as discrete vs continuous is what causes this difference in behavior. Variables assist the researchers, students and analysts in describing patterns, relationships and changes in an accurate manner. In absence of classification, interpretation of data is untrustworthy.
Understanding Discrete Variables
A discrete variable is one that has discrete and distinct values. These values are normally whole numbers, and there are notable discontinuities between these. Put simply, discrete variables are applied in case of counting. The number of values between two discrete numbers is not possible. The value is either present or absent.
For example, if we count the number of students in a class, the answer could be 20 or 21, but it cannot be 20.5. Similarly, the number of cars parked outside a building can be counted as 10 or 11, but not 10.7.
Discrete variables often represent quantities that are countable.
Examples of Discrete Variables
- Number of students in a classroom
- Number of books on a shelf
- Number of goals scored in a match
- Outcomes when rolling a dice
In all these cases, fractional values do not make sense. That is the strongest sign that a variable is discrete.
Understanding Continuous Variables
A continuous variable refers to a variable that may assume any value that falls within a certain range. Continuous variables do not have intervals between the values as discrete variables do. The number of possible values between two points is infinite. Continuous variables tend to be measured and not counted.
As an example, a height of a person can be 160cm, 160.2cm, or 160.25cm. Regardless of the accuracy of the measuring, there is always a chance of a more accurate value.
This is why continuous variables are often associated with physical measurements.
Examples of Continuous Variables
- Height of a person
- Weight of an object
- Time taken to complete a task
- Temperature of a room
All these values may possess decimals and fractions, and they may be more accurately measured in case it is necessary.
Discrete vs Continuous: Core Difference in Simple Terms
The simplest way to understand discrete vs continuous is by asking a practical question. Can the value be counted exactly, or does it require measurement? If counting produces clear whole numbers, the variable is discrete. If measurement allows decimals and increasing precision, the variable is continuous.
Understanding differences becomes easier with visual structure. The table below highlights the core differences between discrete and continuous variables.
| Feature | Discrete Variables | Continuous Variables |
| Nature of values | Separate and distinct | Continuous and smooth |
| Gaps between values | Present | Not present |
| Decimal values | Not allowed | Allowed |
| Data source | Counting | Measuring |
| Common examples | Students, dice outcomes | Height, time |
This analogy explains the difference between discrete variables vs continuous variables as regards their structure and use. Their proximity to one another facilitates learning. This strategy is effective during examinations and in real-life scenarios. It shifts focus from memorization to understanding behavior. Once this habit forms, identifying variable types becomes almost automatic.
Graph Representation to understand discrete vs continuous
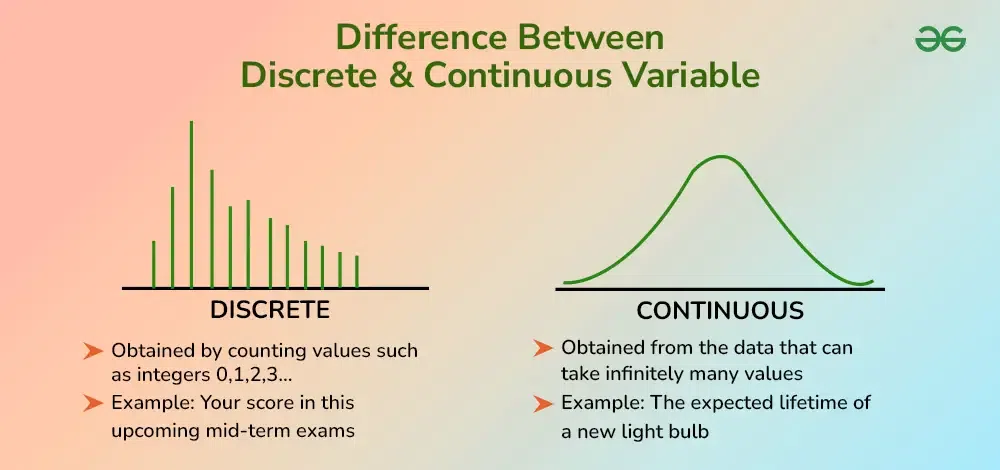
Graphs provide another clear way to understand discrete vs continuous behavior. Discrete data is usually represented using bar graphs, where each bar stands separately. This separation visually reflects the gap between values. Continuous data, on the other hand, is represented using line graphs or smooth curves.
The connection between points shows that values change gradually without breaks. This smooth flow matches the nature of continuous variables. Choosing the correct graph is important because the wrong representation can mislead interpretation. Understanding variable type ensures accurate visualization.
Discrete vs Continuous in Probability Concepts
Probability treats discrete and continuous variables differently. Discrete variables use probability mass functions, where each value has a specific probability. For example, the probability of rolling a three on a dice is fixed.
Continuous variables use probability density functions instead. In this case, the probability of a single exact value is zero. Probabilities are calculated over intervals rather than individual points. This difference explains why continuous probability questions focus on ranges rather than exact outcomes. Recognizing this avoids conceptual errors.
Common Student Mistakes Beyond Discrete vs Continuous
The students usually lose marks not because of some calculation mistakes, but because of mistakes in understanding how the data works. These errors are typically caused by paying attention to numbers rather than meaning and this causes misclassification and analysis.
1. Treating Rounded Values as Fixed Data
One frequent error occurs when learners assume that rounded numbers change the nature of data. Age is commonly written in whole years, which leads many to believe it is count-based. In reality, age progresses constantly and rounding does not alter its underlying behavior.
2. Choosing the Wrong Graph Type
Another common issue involves graph selection. Students often use bar graphs for measurements like height or time, which misrepresents how values change. Graph choice must reflect whether values transition smoothly or remain separate.
3. Ignoring Measurement Precision
Many learners stop at whole numbers even when precision matters. This habit reduces accuracy and leads to flawed conclusions, especially in scientific or analytical problems.
4. Confusing Counts With Observations
Some students treat survey responses and physical measurements the same way. Counts reflect exact totals, while observations often involve estimation and scale, which requires different handling.
Applications in Real Life
The difference between discrete and continuous variables is not limited to classrooms.
- Engineers use continuous variables for measurements like voltage and pressure
- Doctors use continuous data for body temperature and blood pressure
- Businesses use discrete data for customer counts and product quantities
- Scientists rely heavily on continuous measurements in experiments
A wrong classification can lead to incorrect analysis and conclusions.
Conclusion: Why Discrete vs Continuous Matters
Understanding discrete vs continuous variables strengthens the foundation of statistics and data analysis. The discrete variables are useful in counting the number of exact outcomes, whereas continuous variables are useful in measuring the changing quantities with accuracy. This difference influences graphs, probability and interpretation of the real world.
In cases where students concentrate on the meaning and not memorization, mistakes become minimal. To enhance the understanding, it is always good to revisit examples and use the concept in real life to ensure clarity of the concept. A good understanding of discrete vs continuous will ensure that higher-order topics do not look so daunting.
Read More Blogs:- How Is Quxfoilyosia Shaping Modern System Efficiency